Written by Dr Adrian Cooper of Felixstowe’s Citizen Science Group (FCSG)
Felixstowe’s Citizen Science Group (FCSG) was founded in April 2018 to conduct data collection, analysis and visualizations on behalf of Felixstowe’s Community Nature Reserve (FCNR). Their Facebook page contains a wide range of examples of this work.
Throughout June this year, FCSG contacted a sample of 100 FCNR members and asked them if they had seen an improvement in the biodiversity in their gardens and allotments as a consequence of their adoption of wildlife-friendly practices recommended by FCNR.
The results were compared with a similar exercise conducted at the same time last year. They were also sub-divided between wildlife-friendly gardens and allotments in the north, south, east, west and central sections of the Felixstowe area. The results are shown below:
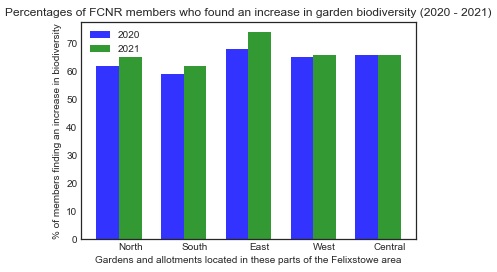
From a local perspective, these results are encouraging. However, more community-based conservation work needs to be done.
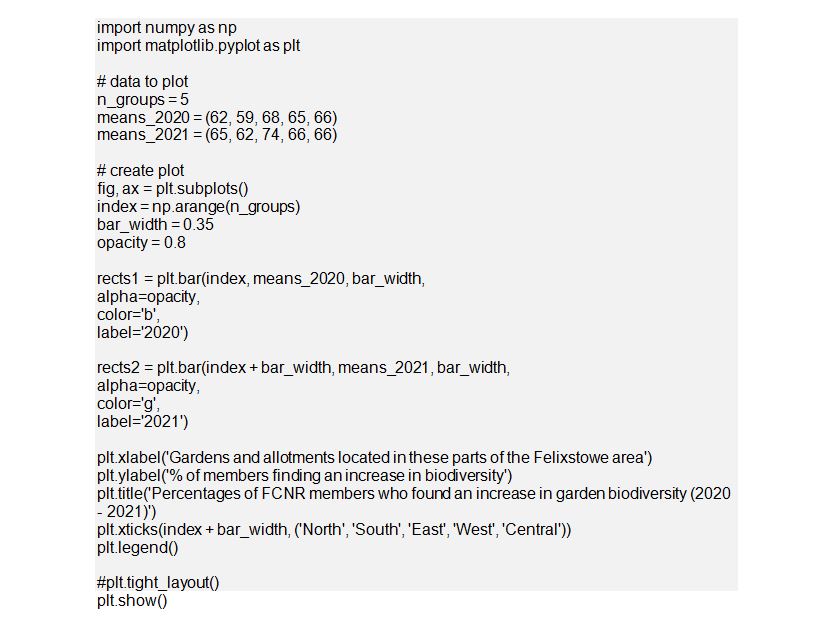
For other readers, there might be interest in conducting a similar exercise in their own locality. I therefore include the Python 3 code which was used in this exercise to create the bar charts shown above.
I hope readers will be able to adapt this Python code for their own purposes.
Find out more about Python.
Other articles written by Dr Adrian Cooper: