Written by Dr Adrian Cooper of Felixstowe’s Citizen Science Group (FCSG)
Felixstowe’s Citizen Science Group (FCSG) is a team of 35 volunteers who started to work together in April 2018. Their aim is to conduct data collection, data analysis and data visualisations on behalf of their local community nature reserve. This discussion shows how FCSG developed its work with R – a statistical analysis and graphics technology.
Beginning the process
To begin the process, FCSG drew up a system map to show where the group stood in relation to its stakeholders. This is shown below:
Fig 1: Systems Map: The use of R by FCSG
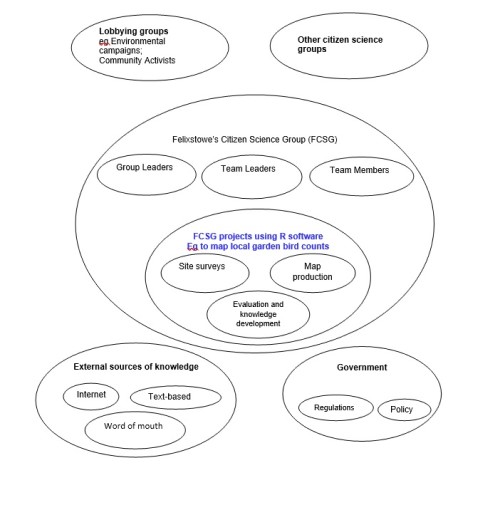
The benefit of completing this system map was to show the main groups of stakeholders who would be interested in any technology, or results, which FCSG got involved with.
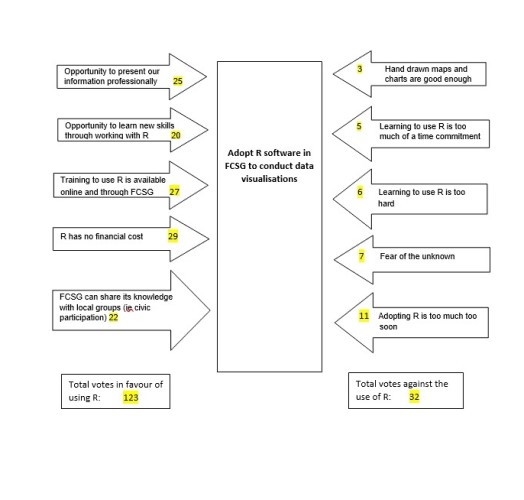
Having identified the stakeholders through their system map, the next stage was for FCSG members to discuss whether their work would be benefitted by the adoption of R technology. The Force Field Diagram shown below shows the arguments for and against. Each opposing set of arrows also shows the votes, in favour and against, for each item of discussion. The results were conclusively in favour of the adoption of R.
Fig 2: Force Field Analysis on why FCSG chose to work with R
Having voted in favour of R, the next stage was to choose a project which would be of interest to as many of FCSG’s stakeholders as possible, and which would maximise the value of R to the group. Again, a lot of discussion was encouraged by FCSG leaders. This was important because no one wanted any projects to be imposed on them as a ‘top down’ management decision. Instead, all FCSG members were encouraged to participate, so the final decision was as democratic as possible.
Eventually, it was decided that a Raster Block map should be attempted which shows the number of birds which were counted in different parts of a local back garden over a given number of days. It was agreed among FCSG members that this use of R technology maximised its value because it had a very high level of visual impact, it contains a significant amount of scientific information, and it is fairly straight forward to create. The finished Raster Block map from a back garden owned by Trish and Mick (two members of Felixstowe’s Community Nature Reserve) is shown below:
Fig 3: Map of bird counts in each quadrat of a Felixstowe garden using R
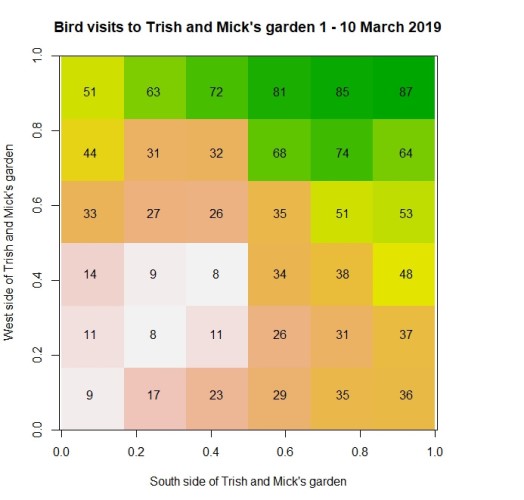
The procedure for conducting these raster block surveys is as follows:
- A small group of FCSG members is invited by local garden owners in the Felixstowe area to survey their back garden for the distribution of bird sightings.
- The garden is divided into survey squares measuring 2 yards across.
- Totals of birds counted in each survey square are collated. The data is added to an R program, and a map is produced of the type shown in Fig 3.
- The benefit of producing this kind of map is to reveal where the garden is most, and least, successful in attracting birds.
Other examples of FCSG’s use of R are on their Facebook page.
When the raster block map in Fig 3 was shared on the FCSG Facebook page, it received unanimously positive feedback from readers across the UK, Europe, North America and Asia.
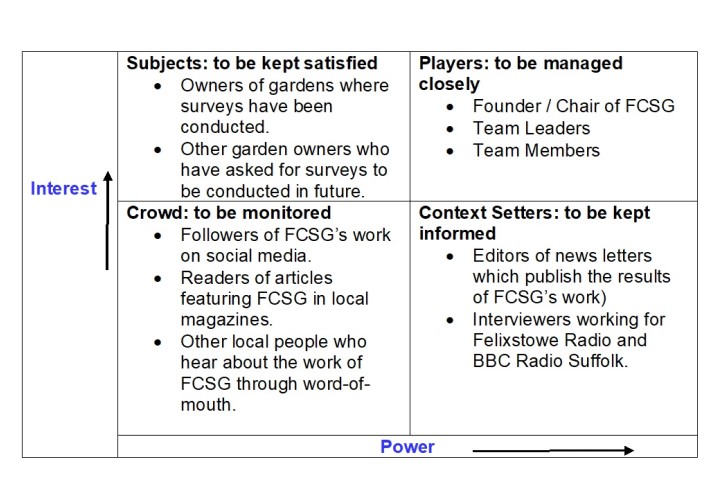
Facebook feedback is encouraging. However, FCSG wanted to be more objective in its evaluation of R technology. The following table shows how FCSG members chose to weigh the relative importance of feedback from different groups of their stakeholders:
Fig 4: Stakeholder Analysis on FCSG’s use of R
FCSG’s current evaluations aim to be as holistic as possible. They are also future-oriented through their focus on improved learning and knowledge among FCSG members. However, FCSG’s evaluations are only developed through informal, unstructured conversations. Although these conversations are constructive, friendly, encouraging and inclusive, they are not focused consistently, or clearly, on an agreed agenda of themes. This is an area in their use of technology where FCSG can improve. The group realises this and is taking steps toward this improvement at the time of writing.
Reflection and learning
The value of R technology to FCSG is agreed among its members and other stakeholders to focus on its capacity to generate helpful new local knowledge; its ability to provide learning opportunities through scientific data visualisation; and its additional value as a civic / community resource, not only in Felixstowe but to other community groups from near-by towns and villages who learn from FCSG’s experience as a form of innovation diffusion. This three-part definition of valuing R in FCSG accords with the aim of FCSG to be a community-based organisation which focuses on generating new local knowledge, creating learning opportunities and enabling civic participation.
For some critics, FCSG’s approach to R does not exploit its full technical potential. In reply, it must be conceded that that suggestion is valid. Equally though, FCSG was only founded in April 2018, and is only resourced by volunteers, most of whom had never done any citizen science before. It might therefore be suggested that the capture and maximising of value from R by FCSG is growing from a modest starting point. Simultaneously, it must be pointed out that FCSG’s use of R has been enthusiastically complimented by observers such as the Suffolk Biodiversity Information Service, Suffolk Wildlife Trust, and the European Citizen Science Association.
Sustainability
The sustainability of FCSG’s value-capture from R software can be attributed to three main factors: group cohesion and shared leadership, its sense of future-orientation and agility, and the way FCSG learns from other organisations.
However, the most important point to appreciate about the sustainability of FCSG’s use of R is not the current positives, but the potential challenges in future. Like almost every organisation, the future sustainability of R in FCSG is multidimensional, dynamic and therefore uncertain. Today’s supporters may become tomorrow’s opponents. Members of FCSG may reply that there are 35 active and passionate supporters of R at the moment. Whilst that is true, those individuals may not be present, or so active, in future. Long term sustainability of R in FCSG is therefore less certain than first appearances might suggest.
One encouraging feature about the current profile of sustainable features is FCSG’s high approval among other citizen science groups. At present, those other groups are learning from FCSG. However, in future, it would be wise for FCSG to learn from, and collaborate with, those other groups when they have become more established. In turn, that interactive learning might attract more supporters to FCSG, and fresh innovation within the emerging network of local citizen science groups, including FCSG and people from neighbouring towns. Membership of that network would almost certainly help with FCSG’s sustainability and value-maximisation.