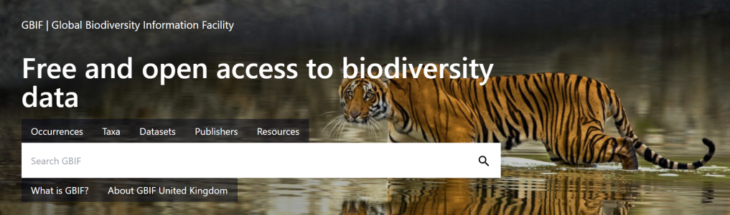
GBIF has launched a new website consolidating developments around taxonomic backbone handling, event data exploration, improved search and download, web stack consistency and custom data dashboards.
The new version of the main GBIF.org website, introduces the Catalogue of Life as the default taxonomy for organising occurrence data, user-customisable dashboards, improved presentation of sampling event data and full alignment with the technological stack powering the GBIF hosted portals programme. While adding new features and improved functionality, the overall site maintains a similar structure but with many adjustments intended to improve the user experience.
Key changes in the new website
1. New taxonomic backbone: Catalogue of Life
One of the biggest changes is that GBIF now uses the Catalogue of Life (COL) as its default taxonomy for organising species occurrence records. Previously, GBIF used its own taxonomic backbone.
Why this matters:
- More frequent updates (monthly).
- Better inclusion of newly described species.
- More detailed classification levels, allowing users to search broader groups such as vertebrates, fishes, or specific subfamilies more easily.
For users who still need the old system, GBIF has temporarily kept the previous website available at old.gbif.org.
2. Better support for ecological and sampling-event data
The site now improves how users find and explore sampling-event datasets (data collected through surveys, monitoring programmes and ecological inventories).
Users can:
- Search datasets containing specific data standards such as the Humboldt Extension.
- Explore events at multiple levels within a dataset.
- Filter events by methodology, scope, effort and other characteristics.
This is especially useful for ecologists and environmental researchers.
3. More powerful search and filtering
The occurrence search interface has been upgraded. Users can now:
- Include or exclude records more precisely.
- Build complex searches directly on the website using GBIF download predicates, a feature that previously required use of the API.
This makes advanced data discovery much easier for non-technical users.
4. Record relationship visualisation
The site introduces a visual way to explore clusters of related records. Records are displayed as connected nodes, making it easier to understand relationships such as:
- Specimens shared among institutions.
- Observations linked to physical materials.
5. Custom dashboards
A major new feature is the ability to create and share custom dashboards.
Users can:
- Build visual reports on any subset of GBIF occurrence data.
- Display maps, charts and summaries.
- Save dashboards for future use.
- Share them with colleagues, who can further customise them.
This is particularly valuable for reporting, stakeholder engagement and project monitoring.
Feedback
All users of GBIF.org are invited to provide feedback on the website through the integrated feedback system (accessed via the rectangular speech bubble in top right corner), via Github or by email to helpdesk@gbif.org.
You can read the full announcement on the GBIF website.