Having started to analyse the use of the NBN Atlas through Google Analytics, we wanted to share the statistics from launch on 1st April, to date.
Users
The table below shows the average number of users per day, week, fortnight and month for the period 01/04/17 to 31/07/17.
| Period | Average Active Users |
| 1 day | 672 |
| 7 day | 2858 |
| 14 day | 4905 |
| 30 day | 9229 |
The figures below show the total number of users in the periods 01/04/17 to 31/07/17 and 01/08/17 to 15/08/17 and the percentage of new and returning visitors to the NBN Atlas in the same periods respectively.
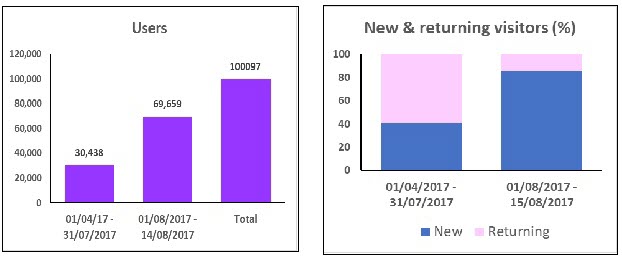
The reason for the split in the analysis is due to a BBC News article which ran on 12th August. The news story included information about using the NBN Atlas to check for Japanese Knotweed prior to a house purchase, which saw a large increase in visits to the site. The number of new users increased from around 300 per day prior to the 11th, to 49,753 on the 12th and 11,664 on the 13th August. Therefore, all analyses below show the period 1st to 15th August separately to account for the atypical usage following the article. The figures for the 1st April to 31st July are a more realistic reflection of use.
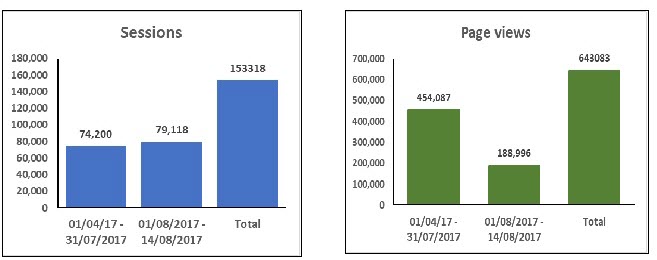
Sessions & Page Views
The charts below show the number of individual sessions and number of page views in the periods 01/04/17 to 31/07/17 and 01/08/17 to 15/08/17 respectively.
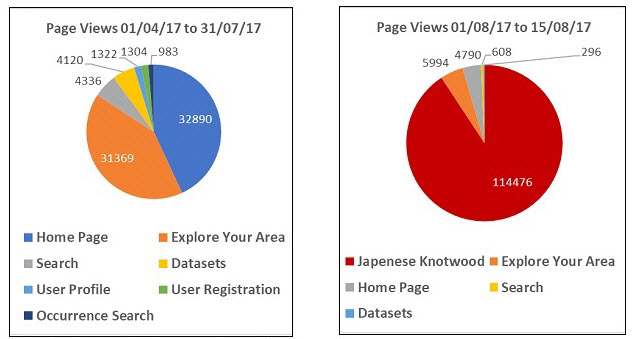
The charts below show the most frequented pages in the periods 01/04/17 to 31/07/17 and 01/08/17 to 15/08/17 respectively. These accounted for 84.5% of all page views in the first period and 97.3% in the second period.
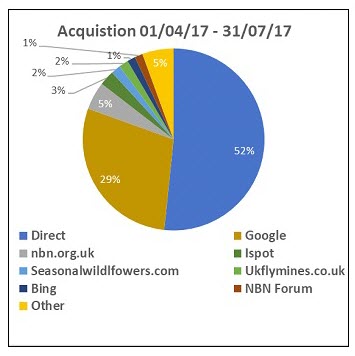
Acquisition
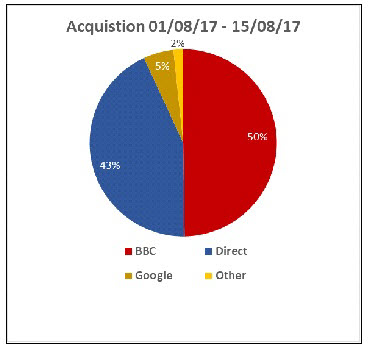
The charts below show the acquisition of users, i.e. how they came to the NBN Atlas, in the periods 01/04/17 to 31/07/17 and 01/08/17 to 15/08/17 respectively.
We will continue to analyse the site based on Google Analytics data and will bring you further updates on use, in the future.