Written by Rich Burkmar, Field Studies Council
Prior to starting work as a project officer with the Field Studies Council in 2013 I had worked variously, over more than 20 years, as a LERC manager, a programmer with the NBN, a local BAP coordinator and a commercial application developer. In all of those roles GIS was an essential tool in my day to day work. But GIS is not central to my role at the FSC and for the first time in decades I found myself without MapInfo, ArcGIS, or any other GIS on my computer. I missed it! As a naturalist, GIS had become integral to the way I think about and explore biological records.
The time had come to try QGIS! Formerly known as Quantum GIS, QGIS is freely available open source software. When I first started exploring it in early 2014, I was astonished by its power and quality. I’ve worked with high-end UNIX systems like System 9, SpatialWare and ArcInfo and PC systems like Idrisi, MapInfo, ArcGIS and Google Earth; QGIS more than holds its own with them all. For a non-commercial product the documentation is good and I picked it up quickly enough by working through an online tutorial.
Even more surprising to me was the development environment. I’ve written plugin tools for MapInfo and ArcGIS (amongst others), but in my experience QGIS’ API (Application Programmer’s Interface) beats them both hands-down. As soon as I became aware of the richness, openness and quality of the QGIS development environment, I started writing a plugin to help me do the things that biological recorders find most useful with GIS.
The result is the ‘FSC Tom.bio productivity tools for biological recorders’. This plugin is published in the official QGIS plugin repository and available through the QGIS plugin manager. It is currently a suite of four tools.
- The OSGR tool makes it easy to work with OS grid references in QGIS – displaying grid references at any given precision, locating by grid reference and flexibly creating grids aligned to the OS grid system.
- The Biological Records tool opens spreadsheets of biological records (CSV files) and allows you to simply create map layers by species, either as full biological records or as atlas style maps at any grid size (e.g. hectad or tetrad). It also provides the ability to batch generate images of atlas maps for publication.
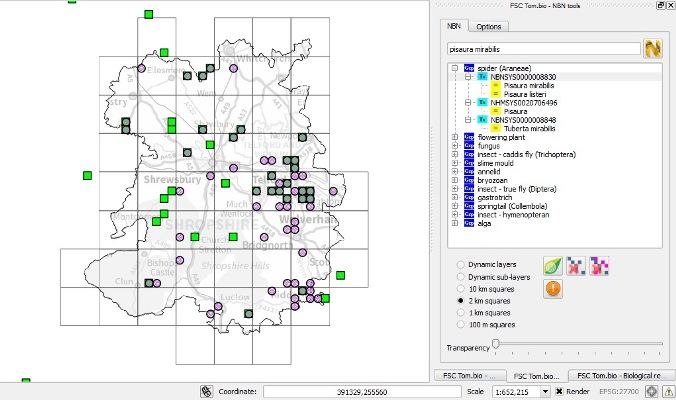
- The NBN tool allows you to display species distribution maps from the NBN Gateway in the GIS and view them alongside other maps and data.
- The Map Mashup tool provides an extremely convenient way to view map images from the internet as GIS ‘raster’ layers in QGIS where they can be compared against data from many other sources, including your own.
The NBN tool makes use of two NBN rest web services – the taxon dictionary and the species Web Mapping Service (WMS) and demonstrates the power of NBN’s strategy to make services available through standard interoperability protocols.
For demonstrations of the QGIS Tom.bio tools, go to YouTube for “FSC tomorrow’s biodiversity” or come along to the NFBR Conference in Sheffield next April where QGIS and the tools will be demonstrated.

Screenshot showing tetrad distribution for the Nursery Web Spider (Pisaura mirabilis) in Shropshire from two sources. Green squares show data from the NBN Gateway (via the Tom.bio NBN tool shown on the right), pink circles show data from the local Spider Group (via the Tom.bio Biological Records tool) and turquoise areas show where the two coincide.
