Written by Robin Boyd of the UK Centre for Ecology & Hydrology
Like all data aggregators, the data held in the NBN Atlas is not evenly distributed among locations, time periods, environments or taxa. For example, there are disproportionately large numbers of records from the south-east of England, from recent years, from lower altitudes and of charismatic taxa such as birds. Depending on how one intends to use the data, uneven coverage in these domains might constitute a “bias”.
Biases present challenges where the aim is to draw general conclusions from the available data. For example, one might want to know how plant distributions in the UK are changing over time. If most of the data come from south-east of England, and common species have been overlooked, then it will be difficult to say anything about common species in northern England and Scotland. It would be helpful for the analyst to know this, so that they can better understand the taxonomic and geographic domains over which their conclusions are relevant.
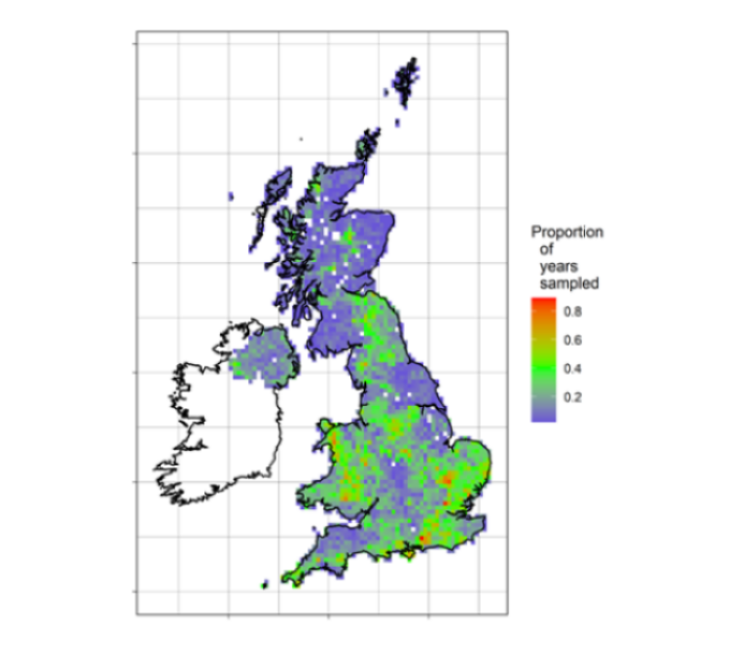
Recently, members of the Biological Records Centre at the UK Centre for Ecology and Hydrology have developed an R package, called occAssess, which enables straightforward screening of species occurrence data for potential biases. All of the information needed by occAssess is provided by the NBN Atlas: species name, coordinates of the record, spatial uncertainty associated with the co-ordinates and year of collection; these can be provided in DarwinCore format, as given by the NBN Atlas. occAssess provides a number of visual “heuristics” which indicate the potential for spatial, environmental, taxonomic and temporal biases. These heuristics include various types of map and time series showing temporal variation in certain features of the data as shown in figure 1 below.

Figure 1. An example of a heuristic produced by occAssess. This map shows the proportion of years (1970-2015) in which there are finely resolved (1km) records for bryophytes summarised in 10x10km grid cells in the UK. This map indicates the degree to which the spatial distribution of sampling has changed over time. Data courtesy of the British Bryological Society.
Reference
Boyd, R., Powney, G., Carvell, C., Pescott, O.L., 2021. occAssess: An R package for assessing potential biases in species occurrence data. Ecol. Evol. doi:10.1002/ece3.8299
